
Building Your Power BI CI/CD Pipeline with the Best Practice Analyzer - Part 2
How to configure BPA in CI/CD: Choosing the right rules and severity levels

In Part 1, I covered why Best Practice Analyzer (BPA) is the ideal first step for your CI/CD pipeline in a Power BI project — helping teams catch issues early, enforce best practices, and improve collaboration through automated checks. But implementing BPA in your CI/CD pipeline isn't a one-size-fits-all solution. Before you integrate BPA into your CI/CD pipeline and move away from using Tabular Editor manually on your computer, there are important decisions to make:
❓Which BPA rules actually matter?
❓Do you want to handle the issues one-by-one or in bulk?
This is where BPA customization comes into play. Not every project needs the same level of scrutiny, and setting the right severity levels can make or break your workflow.
In this post, we’ll cover:
What severity levels (ℹ️Information, ⚠️Warning,🛑Error) actually mean
How BPA behaves differently in Tabular Editor UI vs. CLI, and why is this relevant from CI/CD point of view
How to pick the right BPA rules for your project
Why a balance between automation and manual checks is key
By the end, you’ll have a better understanding of how to create a tailored BPA setup that catches what matters—without overwhelming your team.
Let’s start with a quick review of the different levels of issues BPA can flag at problematic points in your model.
Understanding BPA Severity Levels: ℹ️Information, ⚠️Warning, and 🛑Error
Rules in the BPA come with three levels of severity: Information, Warning, and Error, each serving a different purpose in your workflow.
Here’s an example of each level from the official ruleset:
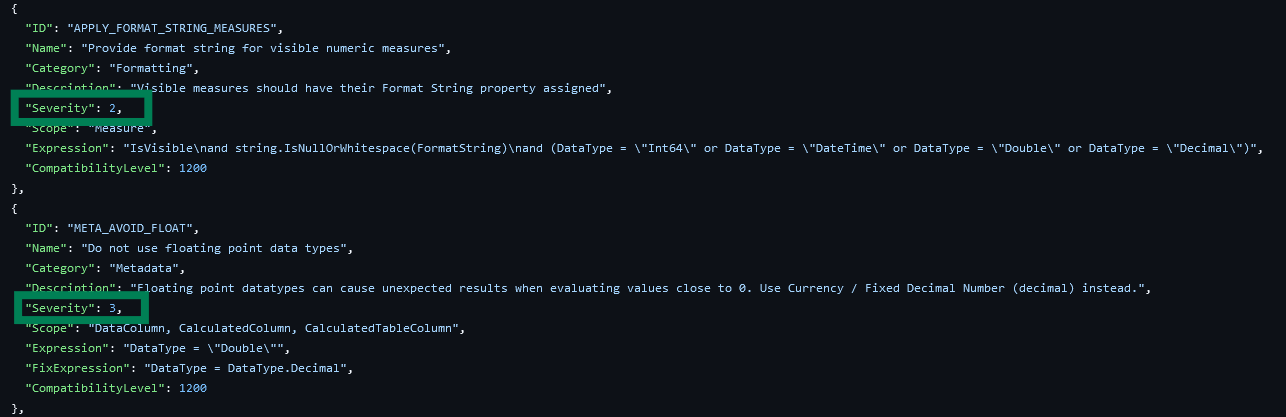
Severity 1: ℹ️Information: There are Row-Level Security (RLS) roles with no members in your model.
Severity 2: ⚠️Warning: There are two measures with different names but defined by the same DAX expression - this should be avoided to reduce redundancy.
Severity 3: 🛑Error: There are numeric columns in your model with default summarization.
The higher the severity level, the greater its impact on your model. Errors (Severity 3) should always be resolved before publishing a model, while warnings (Severity 2) may depend on the context.
These severity levels help prioritize issues. However, not all models require the same level of analysis. In demo reports or one-off solutions, speed may be more important than strictly following model best practices. Additionally, do you always:
need to see a list of every measure without a description?
want to flag all the measures without format string?
Very unlikely.
I recommend experimenting with the BPA rules. You can do this before moving them into your CI/CD pipeline and test them in Tabular Editor. Then you can decide which ones are the most relevant for your specific use case, adjusting the severity levels accordingly or even removing the unnecessary rules from the .json files focusing only on the ones you value.
After the intro to the severity levels, let’s continue with discussing why only relying on the default settings and letting the automation handle everything isn’t the right choice. Let's examine how BPA behaves differently depending on how you run it—a crucial distinction for CI/CD implementation. The way BPA runs and enforces these rules varies depending on whether you’re using the Tabular Editor UI or the CLI (Command Line Interface) and this difference impacts the way you configure and run BPA in your pipeline.
The Critical Difference: BPA in UI vs. CLI in CI/CD Pipeline
When using Tabular Editor’s UI to run BPA, you have the ability to review in a pop-up window all flagged issues and the flexibility to skim through the list, focusing on what matters most to you. This gives you more freedom to disregard certain issues that you might consider less critical, such as formatting or adding descriptions in certain cases. You’ll get notified about the issues but you can freely disregard them, hence you can run rules you are not interested to correct at all.

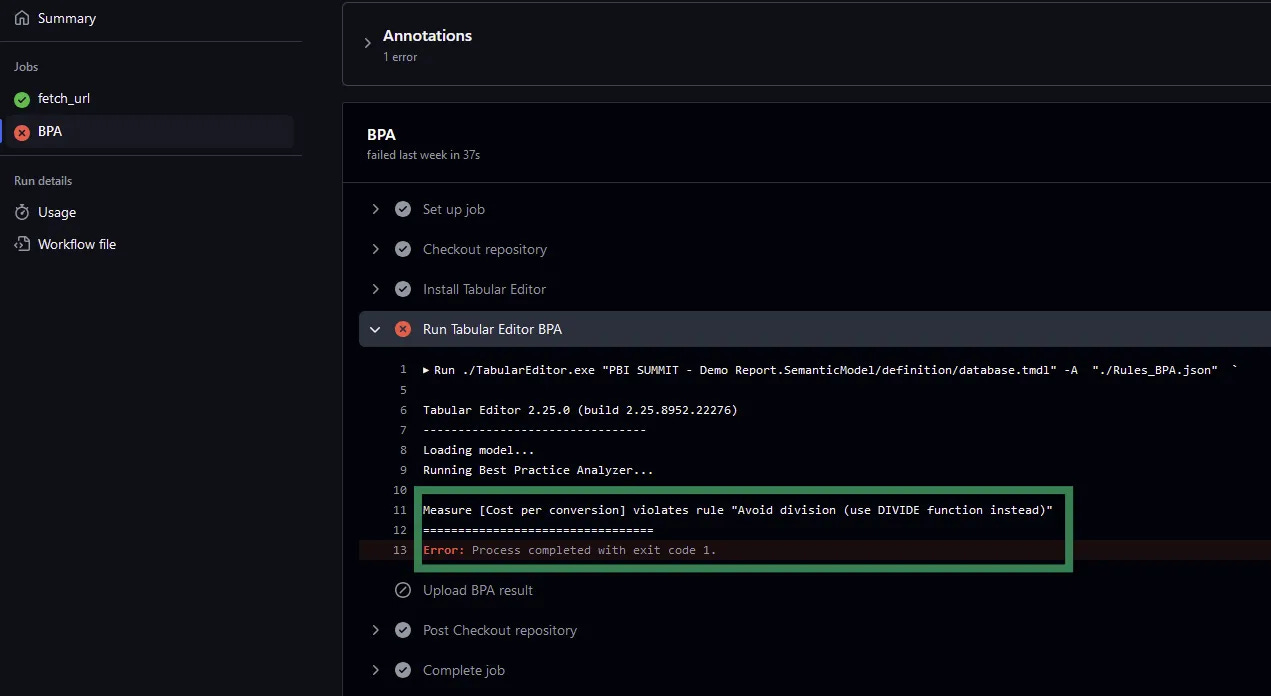
When using Tabular Editor’s CLI (which GitHub Actions relies on), execution behavior changes. Unlike the UI, where you can interactively filter or ignore certain issues, the CLI runs BPA automatically and enforces rules strictly. As a result, errors are flagged more rigidly.
For example, if BPA encounters an Error (Level 3 severity), the process will immediately stop the GitHub Actions workflow. In this case, you won’t end up with the full picture of your model as you would with the UI, you’ll only know that there’s an issue (error) but who knows if there are more or not.
You can change this behavior—for instance, by adjusting the severity of errors, downgrading all of which would otherwise stop your flow and once the whole model is evaluated can you rely on a Python script to analyze the results separately. This would add another layer of complexity to your pipeline but offer more freedom in handling issues. I’ll elaborate this approach later.
This difference emphasizes the importance of deciding early how you want to handle errors in your CI/CD pipeline. While the default stopping behavior might be ideal for smaller projects, larger or more complex models may benefit from running the workflow in bulk, addressing all issues at once.
With an understanding of how BPA executes in different environments, let’s switch the focus on selecting and customizing the right rules for your specific needs.
Fine-Tuning BPA: Choosing relevant rules and setting severity for your team's needs
The first challenge I faced when using the Best Practice Analyzer (BPA) in a CI/CD pipeline was selecting which rules to apply to my models. There are dozens of available rules, and you can also create your own ones using C#. But I didn’t want to see every minor issue flagged.
In addition to deciding which rules to run, prioritizing them is also a challenge. Some rules might be more important than others, and adjusting their severity levels can reflect this. For instance, models where many-to-many relationships are truly needed are rarely needed. So, when I see an N:N relationship, I know it’s likely a data modeling challenge we need to solve as a team.
Another example is handling referential integrity issues - i.e.: when a fact table contains more unique values than the connected dimension table, causing users to see (Blank) values in the model. The default ruleset classifies this as a Severity 2 issue; however, I prefer elevating it to Severity 3. Based on my experience, these issues often lead to unexpected results and incorrect data representation in visuals, which are among the most common causes of misunderstandings and misinterpretations in reporting. I don’t want to let a model with this issue into production, as it can erode trust in BI solutions among business users while also causing major headaches for developers. For this reason, I treat referential integrity issues as critical and ensure they are resolved before deployment.
Another example is the “Provide format string for measures” rule which is marked with level 3 Severity (Error). While it is relevant information, I’d rather flag this as a level 2 Severity (Warning) and allow the team to address these in scheduled maintenance windows instead of blocking deployments.
This balanced approach helps meet strict deployment deadlines while still gradually improve model quality during the testing phase.
There are also rules I just don’t find relevant in most of our use cases, we don’t have a strict naming convention and I don’t need to review/scroll through all notifications on the existence of CamelCase measures. If you don’t enforce strict naming conventions (yet), you don’t need to analyze rules related to this issue—you already know what the results will be.
I hope that by now you can see why custom rule sets are important. They allow you to define which issues are most important for your model, and help prioritize critical issues that directly affect your model’s integrity and performance. By tailoring the rules to your project, you ensure that the CI/CD pipeline is optimized for your specific needs.
To create a custom rule set, you can remove unnecessary rules or modify the severity of rules based on your needs. Save the JSON file and set it as the default ruleset.
// This ruleset only checks if the model contains a division where the / operator is used instead of the DIVIDE function.

[ {
      "ID": "DAX_DIVISION_COLUMNS",
      "Name": "Avoid division (use DIVIDE function instead)",
      "Category": "DAX Expressions",
      "Description": "Calculated Columns, Measures or Calculated Tables should not use the division symbol in their expressions (/) unless the denominator is a constant value. Instead, it is advised to always use the DIVIDE(<numerator>,<denominator>) function.",

// The original severity was 2 which was increased to 3
      "Severity": 3,

      "Scope": "Measure, CalculatedColumn, CalculatedTable",
      "Expression": "Tokenize().Any(\n    Type = DIV and\n    Next.Type <> INTEGER_LITERAL and\n    Next.Type <> REAL_LITERAL\n)",
      "CompatibilityLevel": 1200
    } ]
Finding the Right Balance: Automation vs. Manual Oversight
With BPA set up in your CI/CD pipeline, the next big question is: how much should we automate? At first, it was tempting to automate the entire pipeline and try to set up automated approvals or rejections, but now I’m convinced that this is not the best practice to follow. Balancing automation with manual checks, ensures you maintain oversight without overloading the process.
The key here is to automate tasks that are repetitive and straightforward, such as running BPA to catch obvious issues like N:N relationships or formatting inconsistencies. It’s possible to build automation to fix some of these issues as well. However, when it comes to more nuanced matters, like performance impacts or complex data modeling decisions, understanding the specific situation and trusting your colleagues becomes more important.
In practice, I recommend automating the initial checks, but leave room for manual approvals on complex issues that require deeper analysis.
Conclusion: Your Path to a Customized BPA Implementation
So, how do you implement this? Start by experimenting with BPA’s severity levels—adjust them based on the scale of your project and the issues you anticipate. Through customizing severity levels, selecting relevant rules, and finding the right balance between automation and human oversight, you'll create a workflow that enhances quality without sacrificing efficiency.
Implementing BPA in your Power BI CI/CD pipeline isn't about catching every possible issue—it's about catching the right issues for your team and projects.
It’s good to remember that your BPA configuration should evolve with your team's needs. Start with the basics I've outlined here, then iterate based on feedback and real-world results. If you are not comfortable setting up your CI/CD pipeline yet, you can start experimenting on your computer. Just modify the “BPArules.json“ file and feed it to Tabular Editor CLI or simply run it using the UI to build more confidence in the tool.
The time invested in thoughtful BPA customization pays dividends through more reliable models, faster development cycles, and ultimately, better business intelligence for your organization and clients. Most importantly, the quality of your team’s models will improve as developers will begin anticipating and addressing BPA-flagged issues before even committing their changes.
In the next post, I'll provide the promised step-by-step guide for implementing your customized BPA rules in a GitHub Actions workflow.